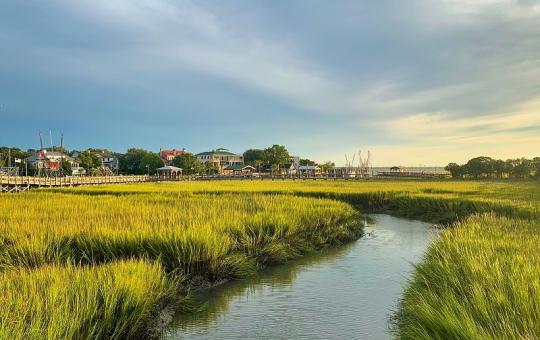
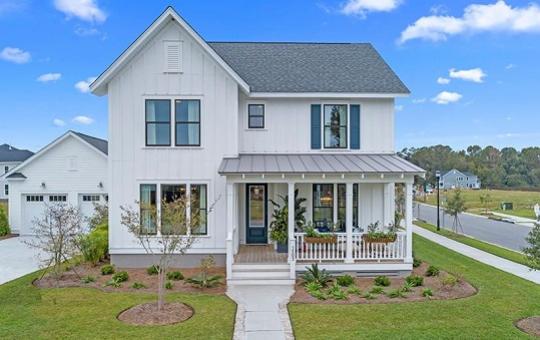
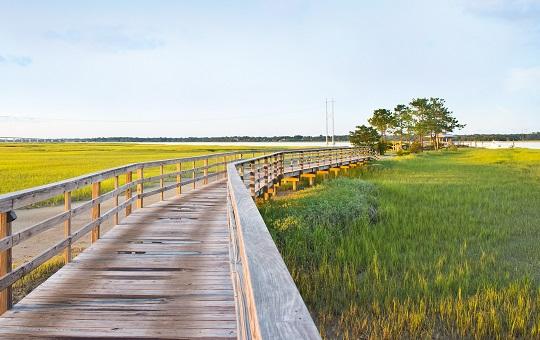
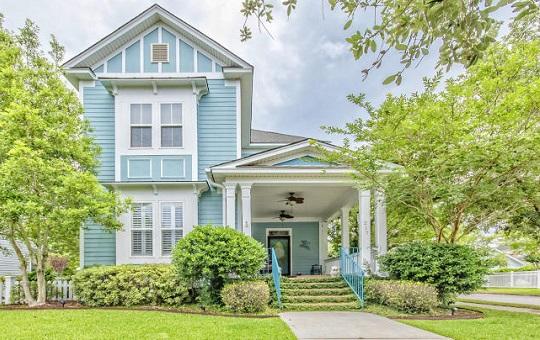
Mount Pleasant Real Estate
Newest Neighborhoods and Best Public Schools in Charleston

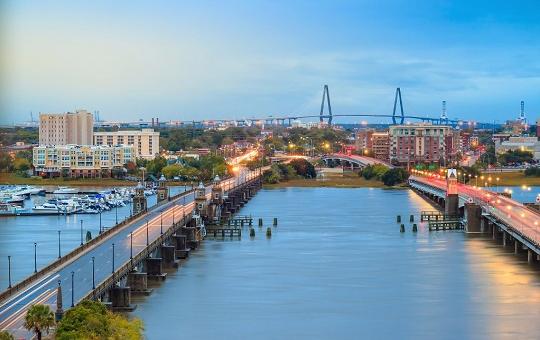
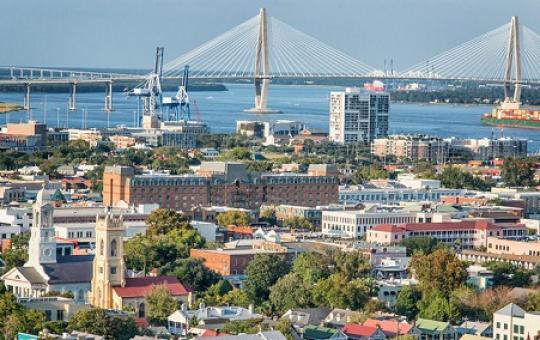
Charleston's housing boom of 2020 to 2023 has been the most active housing market on record for our MLS. Compared to pricier markets across the country (such as Seattle, DC, or New York), Charleston offers a relative affordability combined with a coastal lifestyle and historic charm that create a steady demand from buyers relocating. Milder weather, good healthcare and schools, and an active outdoor lifestyle also add to Charleston’s appeal.
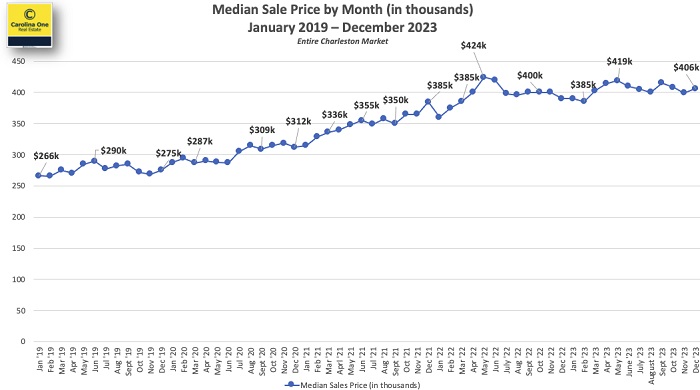
Median home prices in Charleston are a helpful indicator for understanding how strong the demand has been for local real estate. In January 2019 the median sale price was around $266K, and in December 2023 it was about $406K. You can track median home price trends with this graph which dates back to January 2019.
The luxury market in Charleston also remains strong thanks to these buyers relocating from pricier markets and also local homeowners moving up. Charleston homeowners have experienced such rapid appreciation that many are taking advantage of cashing in on their current home and purchasing a larger/more expensive one.
Charleston is still seeing roughly double the sales levels of $1 million+ properties compared to pre-COVID sales (and this is a 3 year trend of such heightened sales levels in the luxury sector of the market).
The short sale and foreclosure market is practically nonexistent in Charleston due to high home equity combined with a low supply of homes for sale. Foreclosures and short sales currently hold steady at a combined .7% of the market which is down from 1.8% before the housing boom which started in spring of 2020.
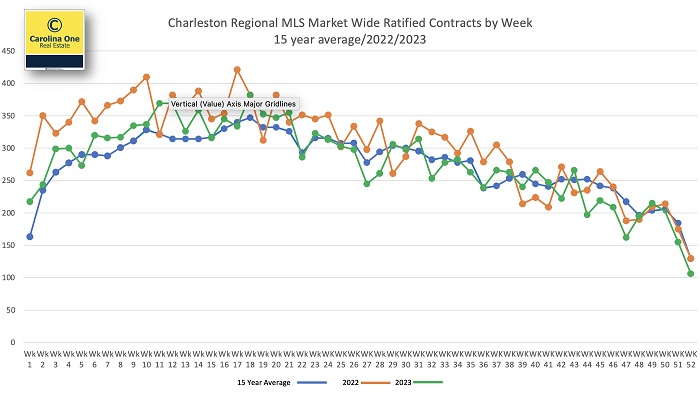
In this chart showing ratified contracts week by week, the green line represents 2023, the orange line is 2022, and the blue line is the 15 year average for Charleston. You’ll see some of last year’s green dots were higher than the previous orange year which is incredible considering 2022 was a record year for our market.
From the fall of last year leading up to the holidays, we saw a seasonal slow down in ratified contracts which is typical when you look at annual Charleston trends.
With the current listing inventory in our MLS, it would take approximately 2,800 additional listings to reach the point that our market would shift from a seller’s market to a balanced market (meaning neither a buyer nor seller’s market). So this shift won’t be happening anytime soon.
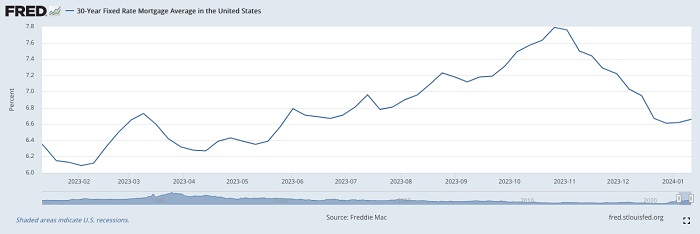
We’re thankful that mortgage rates have recently dropped in a significant way. This graph made by Freddie Mac charts mortgage rates over the past 12 months for a 30 year fixed rate mortgage. Rates peaked around 7.8% in November 2023.
In Charleston, we’ve definitely noticed buyers taking advantage of lower rates based on the number of contracts we’re writing and the frequency of multiple offer situations for the new listings located in the most popular areas to live.
Newest Neighborhoods and Best Public Schools in Charleston
Close to Charleston: Ideal for Commuters
Great Location with a Charming Mix of Old and New Homes
Historic Homes in the Heart of Charleston
Family Friendly Community with a Country Club Feel
Rural Lifestyle Near Charleston
Small Town Living with Affordable Homes and Great Schools

More Affordable Beach Homes with a Laid Back Style
Contact The Keadle Group online or call/text 843.847.0239 to learn why so many clients recommend their family and friends to us!