Year to Date Charleston Real Estate Market Statistics for 2017
Posted by Lee and Katherine Keadle on Thursday, November 16th, 2017 at 2:30pm.
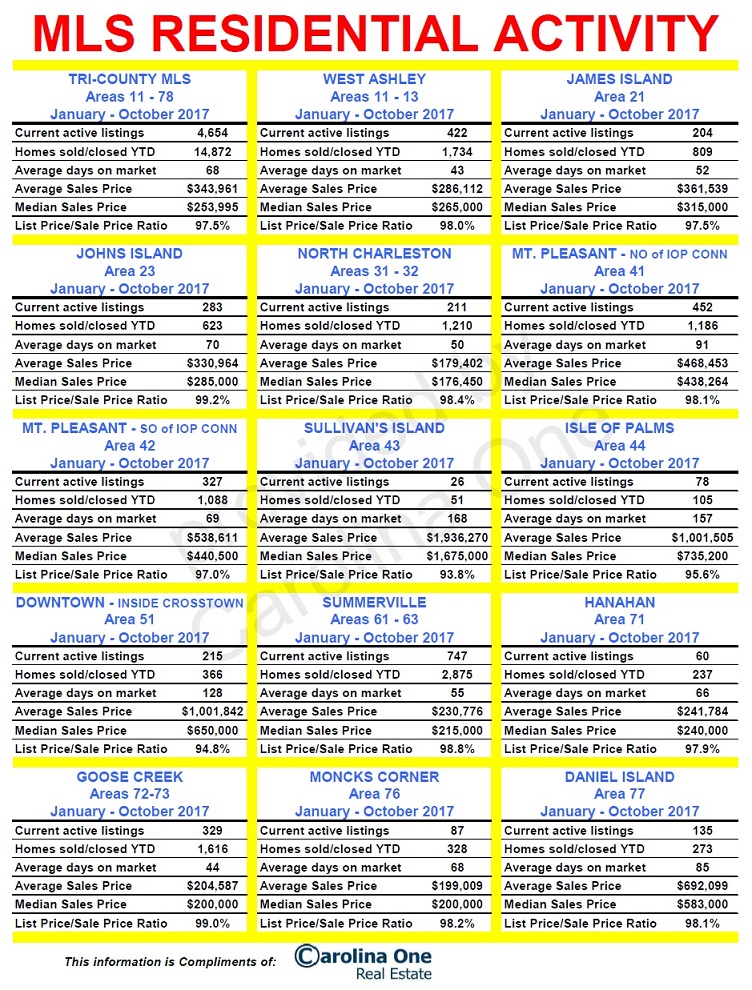
Here you'll see year to date MLS statistics for the tri-county Charleston area:
- During the month of October, there were 1,258 homes that closed which brings the year to date sales number to 14,872. This is a 10 year record for the MLS. Analysts had predicted 2017 would be the #2 best year in the history of the MLS, but current stats show that it might end up being #1!
- Closed homes are up 14% over 2015.
- Buyers are seeing more listings to choose from compared to the last two years, which is great considering the inventory shortage that we’ve experienced. New listings have increased 6% over last year and 11% over 2015.
- The median sales price is up 5% over last year to currently $253,995. The average sales price is up 5% to currently $343,961. Keep in mind that the average prices are always higher than the median because the multi-million dollar homes pull these averages up.
Charleston Market Statistics by Area
Below you’ll see where we’ve broken down the Charleston metro by area so that you can better compare stats for the section where you’re looking to buy or sell. We’ve listed how many homes are currently for sale, the number of sales year to date, how long it takes for a listing to go under contract, the average and median sale prices, and finally the list price to sales price ratio (which shows how much money buyers are currently able to negotiate off the sellers’ asking price). You can view more Charleston real estate statistics by area on our website!